60
13/14
Figure 4 presents the estimated number of coffee planting
materials producedby the different regions;
The estimated annual coffee planting materials produced
progressively increased with 18.6 million in 2011/12, 20.6
million in 2012/34 and 33.8 million in 2013/14. This can be
attributed to wide distribution of coffee planting materials
by UCDA over the last three years. The number of planting
materials produced is reflected in the size of the nursery
structures in place and their capacity to expand and meet
future coffee plantingmaterials demand.
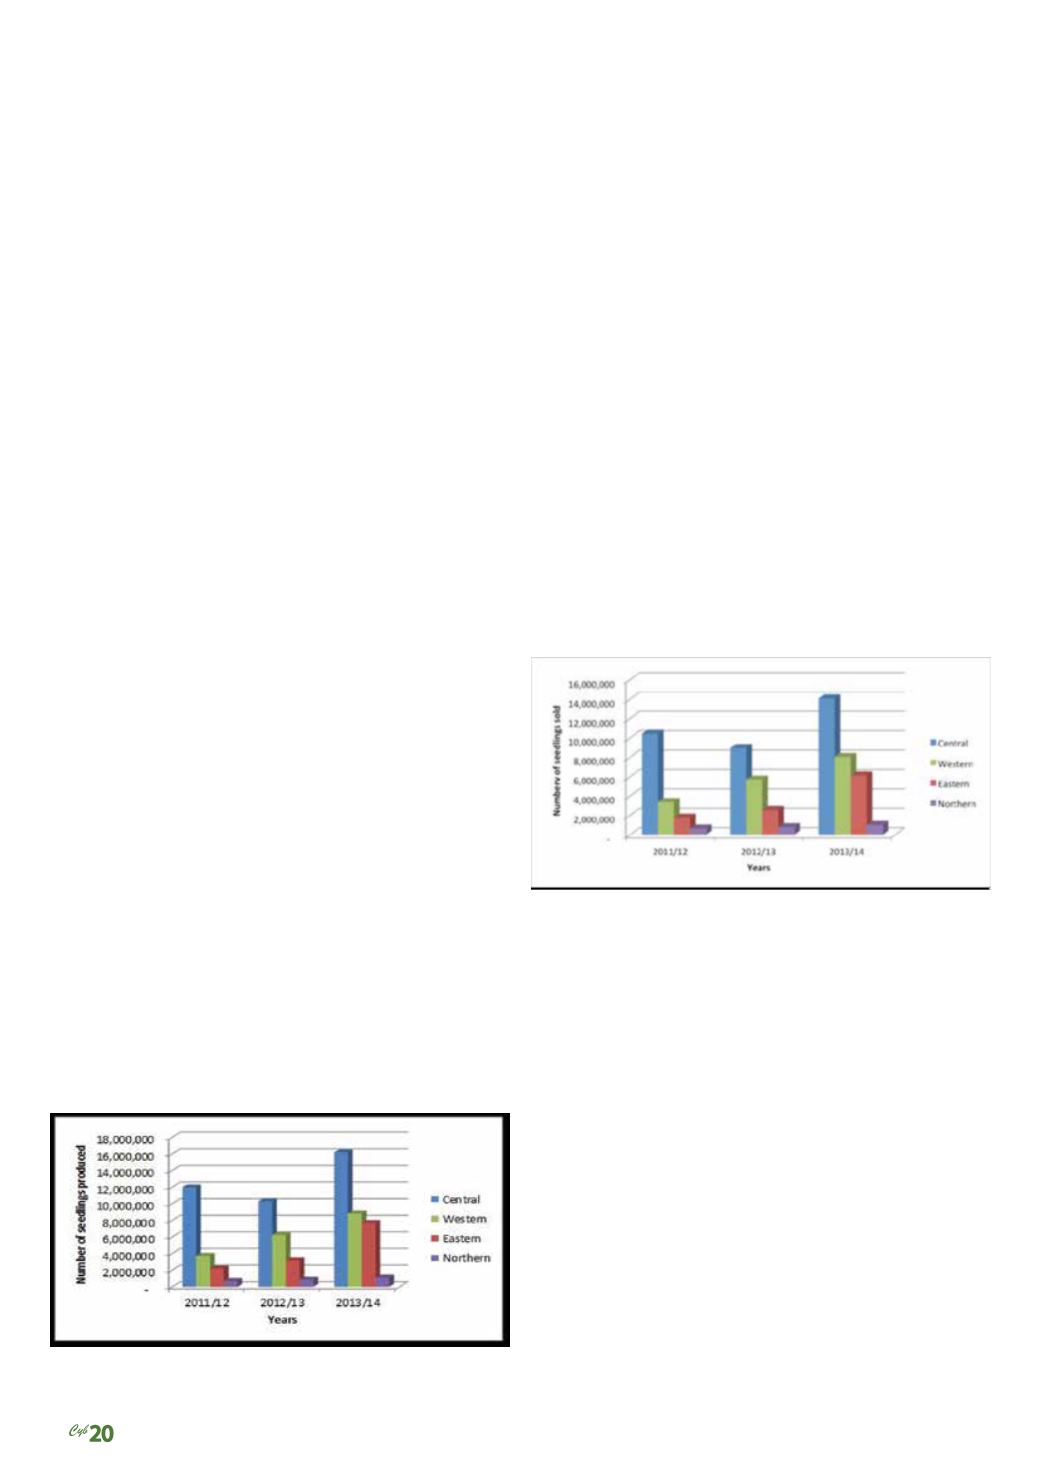
3.3.2 Quantitiesof coffeeplantingmaterials sold
The estimated quantities of coffee planting materials sold by
the nursery operators in all the study districts are presented
in Figure 5. The figure shows progressive increase in the
numbers of planting materials sold from 2011/12, 2012/13
to 2013/14 from 16,272,739, 18,088,566 and 29,376,366
respectively. The central region had the highest number of
planting material sold compared to other regions; however,
not all plantingmaterial producedwas sold. In general, about
15% seedlings produced were not sold but in the eastern
region, theunsoldpercentageof plantingmaterialswent up to
25% of the total production.
Figure 5: Coffee planting materials sold by nursery
operators
Source: Surveydata2014
Table 2 highlights the number of planting material
sold by nursery operators by type. The total number
of cuttings produced was small and all of them were
sold out.
The capacity of the nurseries visited during the study was
categorized under three levels based on the number of
plantingmaterials; small, medium and large.
a)
Small scalenursery:
This category supplies 10,000
to 40,000 seedlings per season of elite materials.
Most of them (90%) did not have a functional record
system and costing of individual seedlings wasmore
of guessworkwitharguments leaningheavily towards
complaints of late payment byUCDA.
b)
Medium scale nursery:
This category supplies
41,000 to 100,000 seedlings per season of elite
materials, constructed using similar materials like
the small nurseries although most of them were in
transition to using shade nets of 70% shade. Record
keeping is also poor but the scanty information
obtainedwas used to generate cost figures.
c)
Large scale nursery:
This category supplies over
100,000 seedlings of elite materials. This category
represented 20% of all the total nurseries visitedwith
most of them having no screen shade net.
Coffeeplantingmaterial produced
Keyassumptionsonnumber
of coffeeplantingmaterials
produced
When estimating the number of coffee seedlings produced in
the country, the following assumptionsweremade:
(i)
The districts in the study area represent 80% of the
total coffee production inUganda;
(ii)
During seedlings production in the second season,
nursery operators produced 30% less number
of seedlings compared to the first season. This is
because the operators wait for UCDA and other
buyers to take the seedlings since one structure
cannot accommodate seedlings for the two seasons.
(iii)
More than 98% of all the nursery operators visited
produced elitematerials compared to cuttings.
Figure4: Estimatednumber of coffeeplanting
materialsproduced
Source: Surveydata 2014


